

Oil Price Volatility in 2026: Supply Disruptions, Market Reactions and What Comes Next
An analysis of oil price volatility in 2026, examining supply disruptions, market reactions, Persian Gulf risks, shipping conditions, and the implications for bitumen, sulfur and global commodity procurement.
Last updated: July 21, 2026

Editorial standard
Reviewed by AurexInsight Research
Last updated: July 21, 2026
AUREXINSIGHT RESEARCH
Oil Price Volatility in 2026: Supply Disruptions, Market Reactions and What Comes Next
An analysis of oil price volatility in 2026, examining supply disruptions, market reactions, Persian Gulf risks, shipping conditions, and the implications for bitumen, sulfur and global commodity procurement.
Executive summary
Oil prices in 2026 are being shaped by more than a simple shortage of crude.
The market is responding simultaneously to physical supply disruptions, uncertainty surrounding Persian Gulf exports, shipping and insurance constraints, inventory movements, refinery disruptions and weaker demand in parts of the global economy.
This combination has created a market in which prices can rise sharply when disruption risks increase, but fall rapidly when supply begins returning, shipping conditions improve or demand expectations weaken.
Research method and limitations
This summary is based on the full AurexInsight report, trade and industry data, and reputable public sources. Market data may be delayed, incomplete, or methodologically inconsistent; independent due diligence is essential before commercial decisions.
Written and reviewed by: AurexInsight Research
Full report and sources: https://aurexinsight.com/en/insights/oil-price-volatility-2026-supply-disruptions-market-outlook
Research method
This analysis triangulates reputable public sources, trade and industry data, institutional reports, and consistency checks. Material source conflicts, limitations, and uncertainty are stated explicitly.
Data limitations
Trade and market data may be delayed, incomplete, or methodologically inconsistent. This report does not replace independent legal, financial, procurement, or commercial due diligence.
Quick Answer
Oil prices in 2026 are being shaped by more than a simple shortage of crude.
The market is responding simultaneously to physical supply disruptions, uncertainty surrounding Persian Gulf exports, shipping and insurance constraints, inventory movements, refinery disruptions and weaker demand in parts of the global economy.
This combination has created a market in which prices can rise sharply when disruption risks increase, but fall rapidly when supply begins returning, shipping conditions improve or demand expectations weaken.
For commodity buyers, the central question is therefore not only whether global oil production is increasing or decreasing. It is whether physical barrels, suitable crude grades, shipping capacity, refinery access and buyer confidence are improving at the same time.
Executive Summary
The global oil market entered 2026 with expectations of relatively moderate prices and expanding supply. Those assumptions changed as conflict and maritime disruption affected one of the world’s most important oil-producing and exporting regions.
Restrictions affecting flows through the Strait of Hormuz reduced exports, forced some producers to limit production and increased pressure on alternative trade routes.
Oil prices reacted strongly, but not in one continuous direction.
Prices initially rose as the market priced in the possibility of a prolonged supply shock. They later declined as some exports resumed, alternative supply increased and weaker demand reduced the market’s ability to sustain extreme price levels. Renewed escalation subsequently restored part of the geopolitical risk premium.
This pattern demonstrates an important feature of oil markets: prices reflect expectations about future availability, not only the amount of oil currently being produced.
According to the International Energy Agency, global oil supply recovered by approximately 4.1 million barrels per day in June 2026 as some Persian Gulf flows resumed. However, worldwide output remained approximately 9.4 million barrels per day below pre-war levels.
The U.S. Energy Information Administration also recorded substantial price reversals. Brent crude averaged approximately $85 per barrel in June, around $22 per barrel below its May average. The decline reflected recovering supply, slower inventory withdrawals and weaker demand expectations rather than the complete disappearance of geopolitical risk.
By 21 July, renewed regional escalation had pushed Brent above $91 per barrel, demonstrating how rapidly the market can reprice disruption risk.
The implications extend beyond crude oil.
Oil-market volatility affects:
- tanker freight and marine insurance;
- refinery operating decisions;
- fuel and petrochemical markets;
- bitumen availability and pricing;
- refinery sulfur production;
- fertilizer costs;
- and procurement strategies across multiple industries.
For businesses, the appropriate response is not to depend on a single oil-price forecast. It is to monitor both financial benchmarks and physical-market indicators while preparing for several possible supply and price scenarios.
Key Takeaways
-
Oil-price volatility in 2026 reflects both physical supply losses and expectations of further disruption.
-
Prices may rise before measurable supply is lost because markets price future risk into contracts.
-
Oil prices can fall during an ongoing conflict when supply begins recovering, demand weakens or the probability of a severe disruption decreases.
-
Brent and WTI are benchmarks, not the final delivered cost paid by every buyer.
-
A partial reopening of a shipping corridor does not immediately normalise production, tanker schedules, insurance or refinery supply.
-
Lower benchmark prices do not necessarily mean lower delivered commodity costs.
-
The impact on bitumen, sulfur, fuels and petrochemicals depends on refinery economics and operating decisions, not only crude prices.
-
Procurement teams should use scenario planning rather than relying on a single price projection.
Oil Market Snapshot: 2026
| Market factor | 2026 development | Why it matters |
|---|---|---|
| Persian Gulf supply | Production and exports were disrupted by regional conflict and restricted maritime flows | The region supplies a major share of internationally traded crude and petroleum products |
| Global oil supply | Some supply recovered in June, but global output remained below pre-war levels | Recovery in production does not mean logistics have fully normalised |
| Brent prices | Prices rose sharply, declined as supply expectations improved and increased again after renewed escalation | Demonstrates how expectations and physical conditions interact |
| Global demand | Economic uncertainty and weaker petrochemical activity limited demand growth | Weak demand can offset part of a supply shock |
| Inventories | Commercial and strategic reserves helped compensate for lost supply | Inventories provide temporary relief but may later require replenishment |
| Shipping | Tanker availability, security concerns and insurance costs increased | Delivered costs may remain high even when benchmark prices decline |
| Refining | Access to suitable crude grades became more difficult | Total crude availability does not guarantee adequate product supply |
| Downstream commodities | Bitumen, sulfur and fuels experienced different levels of exposure | Refinery decisions transmit oil volatility unevenly across markets |
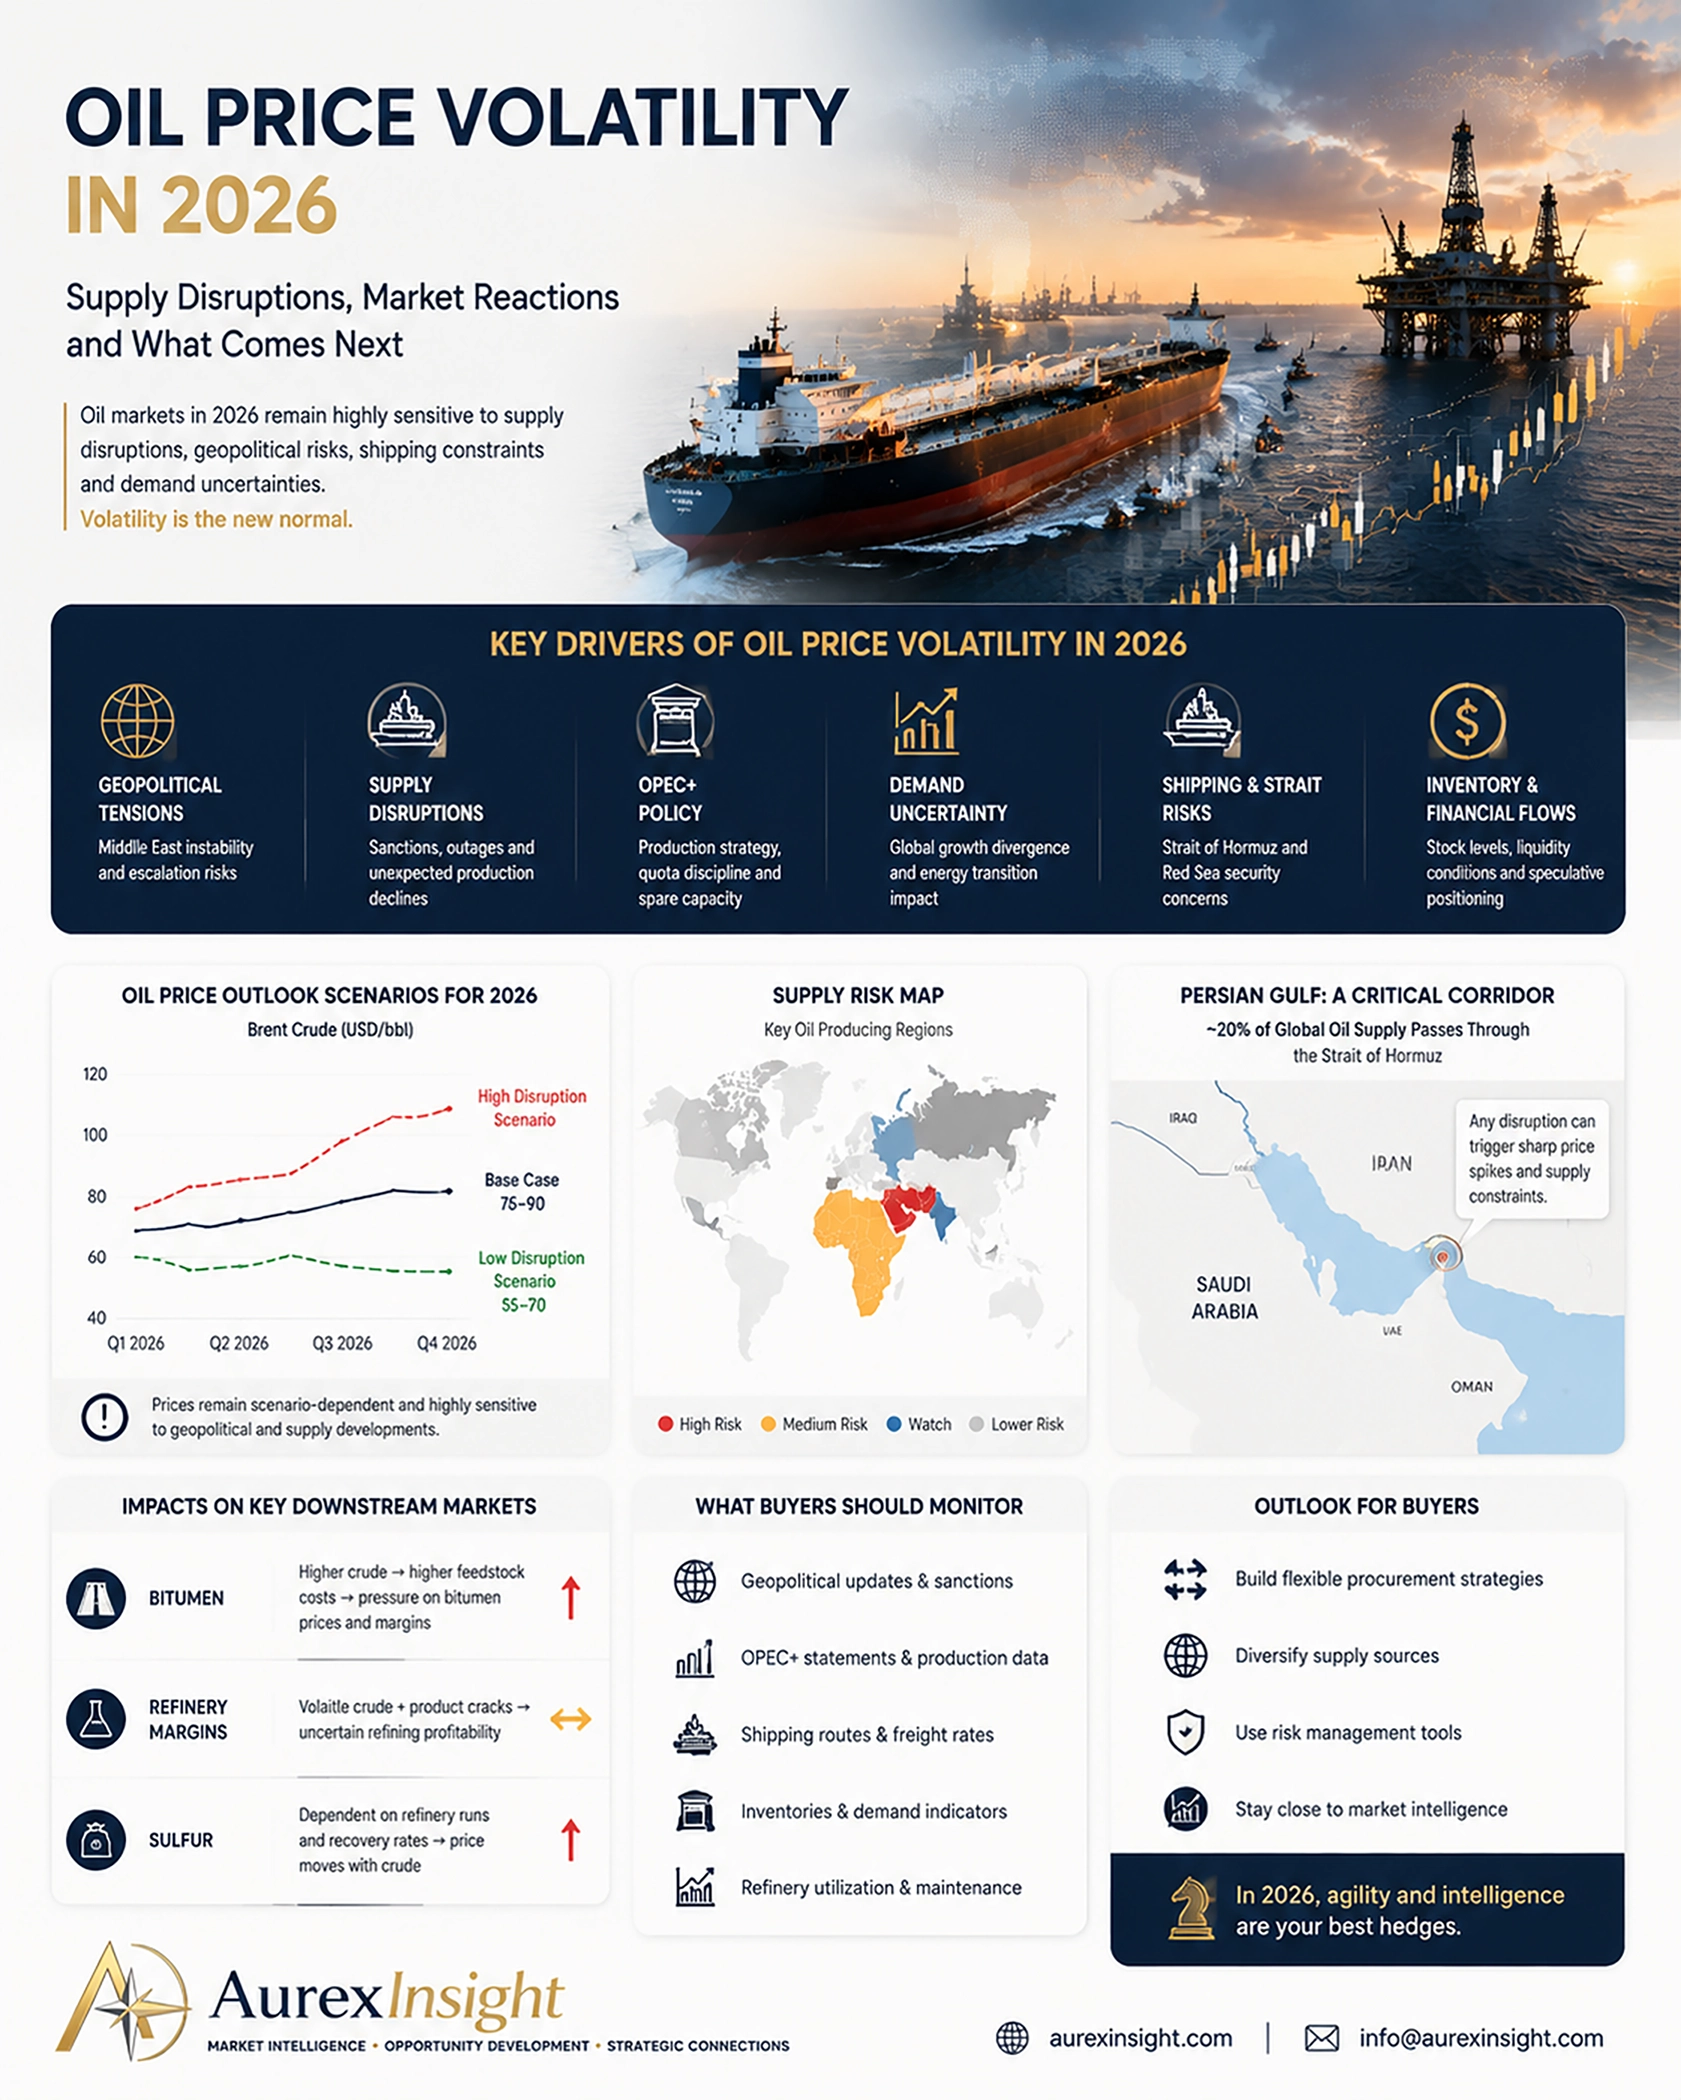
Key Drivers of Oil Price Volatility in 2026
This infographic summarizes the main factors influencing oil price volatility in 2026, from supply disruptions and geopolitical risks in the Persian Gulf to shipping constraints, refinery economics, and the impact on downstream commodity markets such as bitumen and sulfur.
In volatile energy markets, oil prices are not determined only by production levels. Physical availability, shipping capacity, insurance conditions, refinery operations, and supply-chain resilience all influence the real cost and reliability of commodity supply.
This perspective helps buyers and decision-makers evaluate energy markets beyond price movements and understand the broader risks and opportunities across global supply chains.
Part I — Understanding Oil-Price Volatility
Why Oil Prices Have Become So Volatile
Oil markets are forward-looking.
The price displayed on a trading screen is not simply a record of how many barrels are available today. It represents the market’s changing assessment of how difficult oil may be to obtain in the coming days and months.
During stable periods, prices are generally shaped by gradual changes in:
- production;
- consumption;
- inventories;
- refinery demand;
- and economic expectations.
During a major disruption, the process accelerates.
A report involving energy infrastructure, tanker traffic or a major export corridor can alter expectations before official production figures become available.
The market continuously assigns probability to different outcomes:
- disruption may be brief;
- exports may partially recover;
- alternative routes may compensate for losses;
- strategic reserves may be released;
- other producers may increase output;
- or conditions may deteriorate further.
Prices move as the perceived probability of each scenario changes.
This explains why oil prices may fall even while physical conditions remain difficult. A decline can mean that the market considers the worst-case scenario less likely, not that all disruption has ended.
Physical Supply Loss Versus Geopolitical Risk Premium
One of the most important distinctions in oil-market analysis is the difference between actual supply loss and fear of future supply loss.
Physical supply disruption
A physical disruption occurs when oil that would normally reach the market is no longer available at the expected time and location.
Examples include:
- production facilities being shut down;
- export terminals becoming inaccessible;
- pipelines being damaged;
- tanker traffic being interrupted;
- and producers reducing output because storage or export capacity is unavailable.
Physical disruption can be assessed through production data, tanker movements, export volumes, refinery receipts and inventory changes.
Geopolitical risk premium
A geopolitical risk premium is the additional value the market assigns to the possibility that supply conditions may worsen.
It can emerge even before current production declines.
Prices may rise because buyers fear that:
- a shipping route could become inaccessible;
- infrastructure could be damaged;
- insurers could limit coverage;
- the conflict could expand;
- or disruption could last longer than expected.
The risk premium can also disappear quickly when confidence improves.
Why the distinction matters
If prices rise mainly because of fear of future disruption, they may decline rapidly when that fear decreases.
If prices rise because large physical volumes have already been lost and inventories are falling, higher prices may persist for longer.
In most disruptions, both forces operate together.
The more useful question is therefore:
How much of the current oil price reflects barrels already removed from the market, and how much reflects the possibility of additional future losses?
Brent, WTI and the Actual Cost of Crude
References to “the oil price” can be misleading.
Crude oil is not one uniform product, and there is no universal price paid by every refinery.
Brent
Brent is the principal benchmark for a large share of internationally traded seaborne crude.
It is particularly sensitive to:
- maritime disruption;
- tanker availability;
- international refinery demand;
- Atlantic Basin supply;
- and geopolitical risks affecting global trade.
WTI
West Texas Intermediate is the main U.S. crude benchmark.
Its price is influenced by:
- U.S. production;
- domestic inventories;
- pipeline capacity;
- refinery demand;
- and access to export terminals.
The expansion of U.S. crude exports has increased WTI’s connection to global markets, although regional infrastructure continues to influence its price.
The final price paid by buyers
Physical crude is generally priced using a benchmark plus or minus a grade-specific differential.
A simplified structure is:
Benchmark price ± crude differential + freight + insurance + financing and handling costs
The differential reflects factors such as:
- density;
- sulfur content;
- refinery yield;
- geographic location;
- availability;
- and buyer demand for a particular grade.
A decline in Brent does not automatically lower a buyer’s delivered cost.
Benchmark prices may fall while freight, insurance, regional premiums or financing costs remain elevated.
For procurement teams, the benchmark is the starting point of price formation—not the final cost.
Part II — Supply, Demand and the Persian Gulf
The Supply Side of the 2026 Market
The supply outlook in 2026 is being shaped by production disruption, partial recovery, alternative supply and logistical constraints.
Some Persian Gulf production and exports resumed during June. However, restoring output requires more than reopening a route.
Recovery may involve:
- inspecting energy and export infrastructure;
- safely restarting production;
- rebuilding storage capacity;
- rescheduling tankers;
- obtaining insurance approval;
- and coordinating new cargoes with refinery requirements.
This means transit can improve before production and exports return fully.
Alternative supply
Producers outside the Persian Gulf can offset part of a regional loss.
Potential replacement sources include:
- the United States;
- Canada;
- Brazil;
- Guyana;
- Norway;
- and other Atlantic Basin exporters.
However, one barrel is not always an operational substitute for another.
A refinery designed for medium or heavy sour crude may not be able to replace it efficiently with light sweet crude without changing:
- product yields;
- operating conditions;
- refinery margins;
- sulfur recovery;
- and residual-product production.
Global supply may therefore appear sufficient in aggregate while particular regions or crude grades remain tight.
Spare Capacity and Deliverable Supply
Spare production capacity is often described as market insurance.
A producer with available capacity may increase output when another source is disrupted.
However, spare capacity is useful only when the oil can be:
- produced;
- transported to an export terminal;
- loaded onto an available vessel;
- insured;
- delivered to the buyer;
- and processed by the receiving refinery.
Capacity located behind the same disrupted shipping route may offer limited immediate support.
Crude quality also matters. Additional light crude cannot always replace missing medium or heavy sour grades.
For market analysis, deliverable spare capacity is more informative than headline production capacity alone.
Demand Can Offset a Supply Shock
Supply disruption has dominated headlines, but weaker demand has also influenced oil prices in 2026.
Oil demand depends on:
- economic growth;
- industrial production;
- road and air travel;
- freight activity;
- petrochemical operations;
- inflation;
- interest rates;
- and consumer confidence.
A price shock can weaken demand by increasing transportation, production and household costs.
This can create a feedback loop:
- disruption raises oil prices;
- higher prices increase inflation and business costs;
- economic activity and consumption weaken;
- lower demand places downward pressure on oil prices.
Petrochemical markets are particularly important. Lower operating rates at petrochemical plants can reduce demand for naphtha, LPG and other petroleum-derived feedstocks even when transport demand remains relatively stable.
This is one reason institutional oil-demand forecasts may differ. Each forecast depends on assumptions about economic growth, conflict duration, fuel prices, petrochemical activity and the pace of supply recovery.
Forecasts should therefore be treated as scenarios—not precise predictions.
Inventories and Strategic Reserves
Oil inventories form a buffer between production and consumption.
During supply disruption, companies may draw from commercial stocks while governments may release strategic reserves.
These measures can:
- increase immediate availability;
- support refinery operations;
- reassure markets;
- and reduce short-term competition for crude.
However, inventory releases do not permanently replace production.
They transfer oil from storage into current consumption and may later create additional demand when reserves are replenished.
Inventory figures also require context.
A market may hold significant stocks, but those barrels may:
- be located far from the affected buyer;
- have the wrong quality for nearby refineries;
- be committed under existing contracts;
- or face logistical constraints.
The relevant question is therefore not simply how much oil is stored, but how much is commercially accessible and operationally suitable.
Why the Persian Gulf Still Matters
The Persian Gulf is central to the global oil market because it combines:
- major crude production;
- substantial export capacity;
- large refining and petrochemical industries;
- LNG supply;
- and dependence on a highly concentrated maritime corridor.
Its importance is not limited to its share of global production.
The region is particularly important to Asian buyers, which rely on Gulf supply because of geographic proximity, term contracts, established commercial relationships and refinery compatibility.
Replacing Gulf crude with Atlantic Basin cargoes can require:
- longer voyages;
- additional tanker capacity;
- higher freight expenditure;
- more working capital;
- different crude grades;
- and revised refinery planning.
Some Gulf producers have pipelines reaching terminals outside the Strait of Hormuz. These routes provide flexibility, but their capacity is limited compared with the normal volume moved through the Strait.
A disruption can therefore be reduced through alternative routes, but not fully eliminated.
AurexInsight has examined the strategic role of this corridor separately in:
- Why the Strait of Hormuz Matters for Global Commodity Trade in 2026
- How Regional Tensions Are Reshaping Global Commodity Markets in 2026
Why Reopening a Route Does Not Immediately Restore the Market
A partial reopening of a maritime corridor can improve market confidence quickly, but operational normalisation takes longer.
Tankers may have been diverted or repositioned. Producers may need to restart shut-in facilities. Insurers may continue charging higher war-risk premiums. Refiners may already have purchased replacement cargoes or changed their crude slate.
Recovery usually occurs in stages:
| Recovery stage | Evidence of improvement | Remaining risk |
|---|---|---|
| De-escalation | Lower probability of further escalation | Political conditions may remain fragile |
| Maritime access | More vessels become willing to transit | Insurance and crew concerns may persist |
| Tanker recovery | Regular vessel movements resume | Congestion and scheduling backlogs remain |
| Production restart | Shut-in output begins returning | Production may remain below capacity |
| Export recovery | Terminals load more cargoes | Cargo quality and destinations may differ |
| Refinery normalisation | Buyers restore preferred crude slates | Product markets may remain distorted |
| Inventory stabilisation | Emergency withdrawals slow | Restocking may create additional demand |
| Freight normalisation | Shipping costs begin declining | Risk premiums may remain above pre-crisis levels |
Benchmark prices may fall during the first stages of recovery while freight and insurance remain elevated.
Part III — Effects Beyond Crude Oil
Shipping, Freight and Insurance
Oil-market disruption affects the cost and availability of maritime transport.
When ships avoid a high-risk route or travel longer distances:
- voyage duration increases;
- tanker availability tightens;
- fuel consumption rises;
- insurance premiums increase;
- and more working capital remains tied up in cargoes.
The disruption can therefore raise delivered costs even when the underlying commodity price is falling.
Longer voyages also increase ton-mile demand—the total distance over which cargo must be transported. The same physical volume of oil may require more ships when each journey takes longer.
This is why shipping markets can remain tight after benchmark oil prices begin declining.
Refinery Margins and Product Supply
Crude-oil supply does not automatically translate into adequate supply of gasoline, diesel, jet fuel, bitumen or sulfur.
Refinery output depends on:
- the crude grades being processed;
- refinery configuration;
- operating rates;
- product demand;
- maintenance;
- energy costs;
- and processing margins.
A refinery may reduce throughput if crude becomes difficult to obtain or product margins weaken.
It may also prioritise transportation fuels over lower-volume products.
As a result, crude prices and refined-product prices can move differently. Fuel markets may remain tight even when crude benchmarks appear calmer.
What Oil Volatility Means for Bitumen
The relationship between crude-oil prices and bitumen prices is not fixed or immediate.
Bitumen is a refinery product whose availability depends on:
- crude quality;
- refinery configuration;
- refinery throughput;
- demand for competing products;
- maintenance schedules;
- regional inventories;
- and export logistics.
Crude prices matter—but refinery economics matter more
Higher crude prices generally increase the feedstock value associated with bitumen production.
However, bitumen prices may rise by more or less than crude depending on market conditions.
For example:
- a refinery may process lighter crude that produces less residual material;
- strong fuel margins may encourage conversion of heavy fractions into other products;
- refinery outages may reduce local bitumen supply;
- road-construction demand may weaken or strengthen independently;
- freight and packaging costs may change;
- and export routes may become more expensive.
In some situations, bitumen availability may tighten even when crude supply is recovering.
This can occur when refineries prioritise higher-value fuel production or process crude grades with lower bitumen yields.
For procurement teams, crude price direction should therefore be combined with monitoring of:
- refinery operating rates;
- regional bitumen inventories;
- heavy-crude availability;
- seasonal road demand;
- export availability;
- and freight costs.
What Oil Volatility Means for Sulfur
Most commercially traded elemental sulfur is recovered as a by-product during oil refining and natural-gas processing.
The effect of oil-market disruption on sulfur is therefore indirect.
Sulfur production may decline when:
- refineries reduce throughput;
- sour-crude availability falls;
- gas-processing facilities operate below capacity;
- infrastructure is damaged;
- or export logistics become constrained.
However, lower oil prices do not necessarily mean lower sulfur prices.
Sulfur pricing also depends on:
- phosphate-fertilizer demand;
- sulfuric-acid production;
- metal processing;
- regional inventories;
- shipping availability;
- and export concentration.
A refinery may restart crude processing while sulfur exports remain restricted by port, storage or shipping conditions.
This is why sulfur supply should be analysed as part of refinery and gas-processing operations—not simply as a direct function of the oil benchmark.
Related AurexInsight research includes:
Implications for Fertilizers and Petrochemicals
Oil volatility can affect fertilizers and petrochemicals through several channels.
These include:
- refinery sulfur availability;
- fuel and electricity costs;
- freight rates;
- petrochemical feedstock prices;
- inflation;
- and regional plant operations.
The relationship with urea is less direct because natural gas is generally the primary feedstock for ammonia and urea production.
However, oil-market disruption can still influence urea through:
- LNG and gas-market conditions;
- marine freight;
- industrial energy costs;
- regional plant shutdowns;
- and buyer risk management.
For this reason, oil, gas, sulfur and fertilizer markets should not be analysed as entirely separate systems.
They are linked by energy costs, refining, shipping and industrial supply chains.
Part IV — Scenarios and Procurement Intelligence
Three Oil-Market Scenarios for the Rest of 2026
A single price forecast would create a false sense of certainty.
A more useful approach is to evaluate three broad scenarios.
Scenario 1 — Gradual De-escalation and Supply Recovery
In this scenario:
- maritime conditions improve;
- production restarts continue;
- tanker traffic normalises gradually;
- alternative exporters maintain supply;
- and global demand remains relatively weak.
Likely implications:
- the geopolitical risk premium declines;
- inventories stabilise or begin rebuilding;
- Brent prices face downward pressure;
- freight and insurance costs decrease more slowly;
- and downstream commodity costs normalise with a delay.
This scenario broadly resembles the assumptions behind more moderate EIA price forecasts, but it depends on a sustained improvement in regional conditions.
Scenario 2 — Prolonged but Contained Disruption
In this scenario:
- some exports continue;
- production remains below normal;
- shipping routes remain accessible but risky;
- insurance premiums stay elevated;
- and periodic escalation creates renewed volatility.
Likely implications:
- oil prices remain highly responsive to news;
- benchmark prices trade within a wide range;
- regional crude differentials remain unstable;
- freight and working-capital costs stay high;
- and buyers maintain larger safety stocks.
This may be the most difficult scenario for procurement because conditions appear manageable but remain vulnerable to sudden deterioration.
Scenario 3 — Renewed Severe Supply Shock
In this scenario:
- transit restrictions worsen;
- regional infrastructure suffers additional disruption;
- alternative routes cannot compensate;
- inventories decline further;
- and strategic reserves provide less protection than earlier in the year.
Likely implications:
- crude benchmarks rise sharply;
- fuel markets tighten;
- tanker and insurance costs increase;
- inflationary pressure returns;
- refinery margins and crude differentials become highly volatile;
- and some downstream products experience physical shortages.
This scenario is not the baseline assumption, but it cannot be excluded while regional conditions remain unstable.
Scenario Comparison
| Indicator | De-escalation | Prolonged disruption | Severe shock |
|---|---|---|---|
| Persian Gulf exports | Gradual recovery | Partial and unstable | Major renewed decline |
| Oil prices | Downward pressure | Wide and volatile range | Sharp upward movement |
| Freight | Gradual normalisation | Persistently elevated | Significant increase |
| Insurance | Declines slowly | Remains restrictive | Availability and cost worsen |
| Inventories | Stabilise or rebuild | Remain under pressure | Accelerated withdrawals |
| Refinery operations | Gradual normalisation | Regional disruptions continue | Wider throughput reductions |
| Bitumen | Supply improves unevenly | Regional pricing remains volatile | Availability may tighten sharply |
| Sulfur | Recovery depends on refinery and gas throughput | Export constraints persist | Production and logistics may both weaken |
| Procurement strategy | Selective restocking | Flexible contracts and safety stock | Security of supply becomes priority |
What Procurement Teams Should Monitor
Commodity buyers should avoid relying on one headline indicator.
A practical monitoring framework should include:
| Indicator | What it shows |
|---|---|
| Brent and WTI | Broad market expectations |
| Brent–WTI spread | Relative international versus U.S. market tightness |
| Physical crude differentials | Availability of specific crude grades |
| Tanker movements | Evidence of actual export and transit recovery |
| Freight rates | Pressure on shipping capacity and delivered cost |
| War-risk insurance | Perceived maritime risk |
| Commercial inventories | Current buffer against supply loss |
| Strategic reserve activity | Government intervention and future restocking demand |
| Refinery utilisation | Strength of crude demand and product supply |
| Fuel crack spreads | Refinery economics and product-market tightness |
| Bitumen availability | Regional refinery and construction-market conditions |
| Sulfur exports | Refinery, gas-processing and port conditions |
| Economic indicators | Direction of future oil demand |
Procurement responses
Depending on exposure, companies may consider:
- dividing purchases across several delivery periods;
- diversifying suppliers and shipping routes;
- negotiating flexible pricing formulas;
- separating benchmark, freight and insurance components;
- maintaining appropriate safety stocks;
- reviewing force-majeure and delay provisions;
- monitoring supplier refinery access;
- and stress-testing working-capital requirements.
The objective is not to predict every price movement.
It is to reduce dependence on a single market outcome.
AurexInsight Executive Insight
The most important lesson from the 2026 oil market is that price direction and market normalisation are not the same thing.
A declining benchmark may indicate that the probability of an extreme shortage has decreased. It does not necessarily mean that freight, insurance, refinery operations, trade finance and regional availability have returned to normal.
Similarly, a rising oil price does not automatically confirm that global inventories are critically low. The movement may reflect increased concern about future disruption.
Three separate balances should therefore be monitored:
- Global volume balance: Is total production sufficient to meet total demand?
- Regional logistics balance: Can available oil reach the markets that need it?
- Crude-quality balance: Are available barrels suitable for the refineries seeking supply?
A market may appear adequately supplied under the first measure while remaining tight under the second or third.
For downstream commodities such as bitumen and sulfur, refinery operating decisions can be more important than the headline oil price itself.
The strongest procurement strategies will therefore combine price monitoring with physical-market intelligence, scenario planning and supply-chain diversification.
Frequently Asked Questions
Why can oil prices fall during a conflict?
Prices can fall when the market believes future disruption will be less severe than previously expected. Partial supply recovery, weaker demand, reserve releases and diplomatic progress can reduce the risk premium even while conflict continues.
Does a lower Brent price mean lower delivered commodity costs?
Not necessarily. Freight, insurance, financing, regional shortages and grade-specific premiums may remain elevated after Brent declines.
Does crude-oil price directly determine bitumen price?
No. Crude prices influence bitumen, but refinery throughput, crude quality, fuel margins, seasonal demand, inventories and freight also affect availability and pricing.
How does oil-market disruption affect sulfur?
Sulfur is recovered during oil refining and natural-gas processing. Lower refinery or gas-processing throughput can reduce sulfur production, while port and shipping restrictions can affect exports independently.
What is the most important indicator for procurement teams?
No single indicator is sufficient. Buyers should combine benchmark prices with physical differentials, tanker traffic, freight, insurance, inventories and refinery operating rates.
Will oil prices remain high for the rest of 2026?
The outcome depends on the pace of supply recovery, regional security, global demand and inventory conditions. Scenario analysis is more reliable than a single fixed price forecast.
Conclusion
Oil-price volatility in 2026 is the result of several forces operating simultaneously:
- physical supply disruption;
- geopolitical risk;
- maritime constraints;
- inventory policy;
- changing refinery operations;
- and uncertain global demand.
The market has experienced rapid price increases and equally significant reversals because expectations change faster than physical production and logistics.
For commodity businesses, the key task is not to predict the next daily movement in Brent or WTI.
It is to understand how changes in crude supply, shipping, refining and demand may affect the actual availability and delivered cost of the commodities they buy or sell.
Oil remains a central market signal—but it must be interpreted as part of a wider industrial and logistical system.
Sources and Methodology
This report combines data and analysis from internationally recognised energy and trade sources. Figures may be revised as new production, inventory and shipping data become available.
Primary sources include:
-
International Energy Agency,
Oil Market Report – July 2026 -
International Energy Agency,
Oil Market Report – June 2026 -
U.S. Energy Information Administration,
Short-Term Energy Outlook – July 2026 -
U.S. Energy Information Administration,
World Oil Transit Chokepoints -
Reuters,
reporting on oil prices, Persian Gulf supply disruption, tanker movements, inventories and refinery-market conditions during 2026.
AurexInsight compares institutional forecasts rather than treating any single projection as certain. Market scenarios are analytical frameworks and should not be interpreted as price guarantees.
Related Research
-
How Regional Tensions Are Reshaping Global Commodity Markets in 2026
-
Why the Strait of Hormuz Matters for Global Commodity Trade in 2026
About AurexInsight
AurexInsight provides independent market intelligence on commodities, energy markets, industrial supply chains and international trade.
Our research is designed to help businesses understand market structure, evaluate risk and identify commercial opportunities through clear, evidence-based analysis.
Disclaimer
This report is provided for general informational and market-research purposes only.
It does not constitute investment, legal, financial, trading or procurement advice. Commodity prices, supply conditions and trade regulations may change rapidly. Readers should conduct independent due diligence before making commercial or financial decisions.
Written and reviewed by
AurexInsight Research
AurexInsight publishes market intelligence, supplier validation insights, trade-flow analysis and opportunity-focused research for international business decision-makers.
View profile and research standardsRelated Research
Continue exploring this market theme
These related insights help build a clearer view of the market context, supply-chain risks and commercial opportunities connected to this analysis.
Top Bitumen Exporting Countries in 2026: Trade Data, Trade Flows and Competitive Analysis
A market-intelligence analysis of the world's leading bitumen exporting countries, reconciling data across UN Comtrade, WITS, and WTO trade databases, and explaining why single-source rankings for this commodity are unreliable.
Read insightMarket OutlookGlobal Bitumen Market Outlook 2026: Supply, Demand, Trade Flows and Price Drivers
An in-depth analysis of the global bitumen market in 2026, covering supply, demand, refining economics, trade flows, pricing drivers, major exporters, and the Strait of Hormuz risk factor.
Read insightMarket OutlookTop Sulfur Exporting Countries in 2026: Production, Trade Flows and Competitive Analysis
A market-intelligence analysis of the top sulfur exporting countries in 2026, covering production strength, export infrastructure, trade flows, competitive advantages, and buyer considerations.
Read insight