

Top Bitumen Exporting Countries in 2026: Trade Data, Trade Flows and Competitive Analysis
A market-intelligence analysis of the world's leading bitumen exporting countries, reconciling data across UN Comtrade, WITS, and WTO trade databases, and explaining why single-source rankings for this commodity are unreliable.
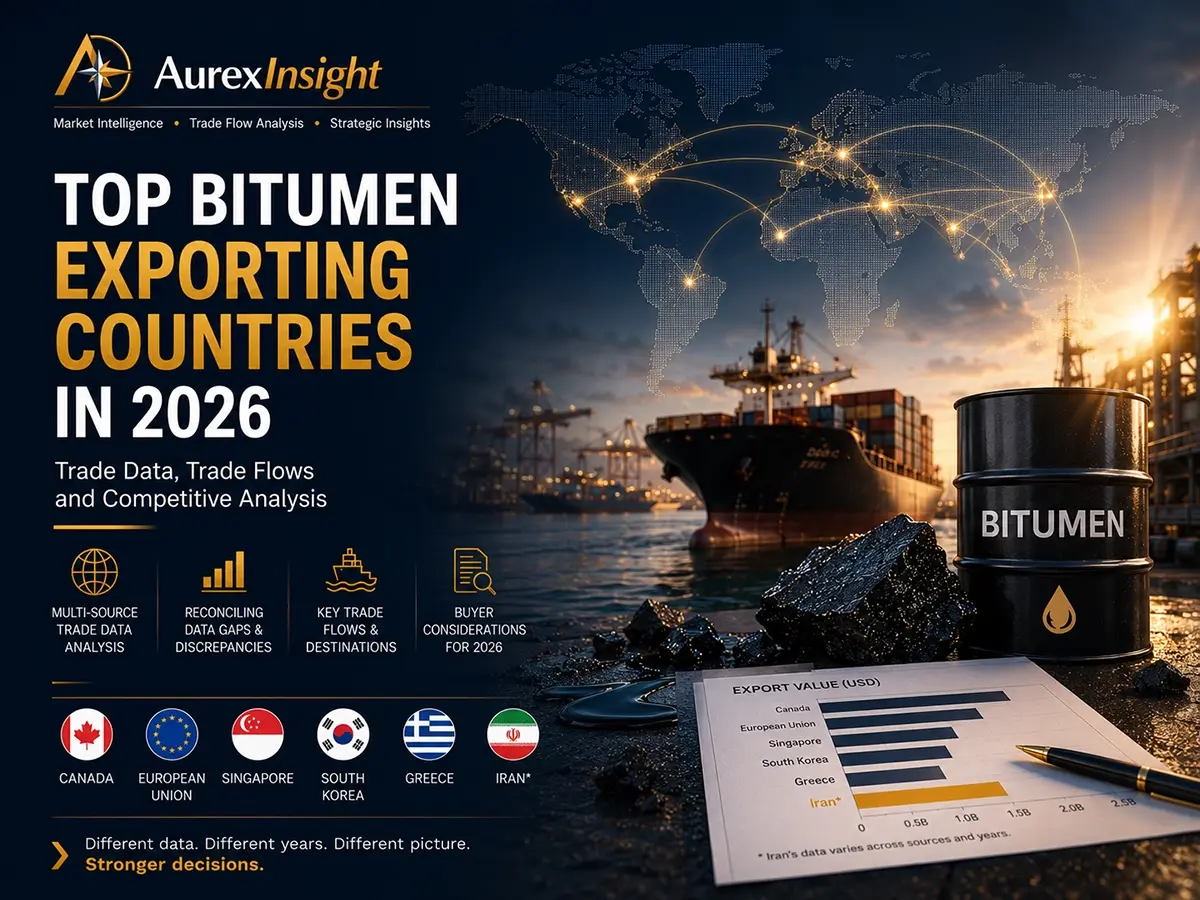
Quick Answer
There is no single reliable "top bitumen exporters" ranking — and any report presenting one without qualification should be read with caution.
Cross-referencing three authoritative trade-data sources produces meaningfully different pictures of who leads global bitumen (HS code 271320) exports:
- UN Comtrade / World Bank WITS, 2021: European Union ($1.81B), Iran ($1.43B, ranked 2nd globally), Canada ($1.30B), Singapore ($1.08B), South Korea ($899M)
- UN Comtrade / World Bank WITS, 2023: Canada ($2.18B), European Union ($1.86B), Singapore ($1.44B), South Korea ($885M), Greece ($724M) — Iran does not appear in this dataset
- WTO Tariff & Trade Data, 2024 (Iran's own reported figures): Iran's bitumen exports were $2.165 billion, roughly matching or exceeding Canada's 2023 figure
Iran's apparent absence from the 2023 Comtrade aggregation is almost certainly a reporting gap for that specific year and database, not evidence that Iran's bitumen trade shrank or disappeared. Two independent, authoritative sources — Comtrade for 2021 and WTO's own trade-data platform for 2024 — both show Iran among the two or three largest bitumen exporters in the world by value.
The practical lesson for buyers and researchers: single-source, single-year bitumen export rankings are not reliable enough to base sourcing or market-share conclusions on. This report reconciles multiple sources explicitly, rather than presenting one dataset's snapshot as definitive.
For broader market context, see:
👉🏻 Global Bitumen Market Outlook 2026
Executive Summary
Ranking bitumen exporters is more difficult than ranking exporters of most other traded commodities, and the difficulty is not simply a matter of finding data — it is a matter of different authoritative databases disagreeing with each other, sometimes substantially, for the same country in the same general period.
This report is built around that difficulty rather than around it. Instead of presenting a single trade database's output as a definitive ranking — a mistake worth naming directly, since it is a common one in commercial bitumen-market content — this analysis cross-references UN Comtrade (via World Bank WITS) across multiple years alongside the World Trade Organization's own Tariff & Trade Data platform, which in some cases draws on countries' own reported customs statistics through a different reporting channel than Comtrade.
The result is a more defensible picture than most bitumen-trading content provides. Canada, the European Union, Singapore, and South Korea appear consistently across multiple years and sources as major exporters. Iran's position is the most analytically interesting finding in this report: absent from one specific Comtrade year (2023), but ranked 2nd globally in Comtrade's 2021 data and reporting a near-identical figure to Canada's leading 2023 value in the WTO's 2024 data. The most defensible interpretation is that Iran is consistently among the world's largest bitumen exporters by value, and that its apparent absence in certain single-year, single-source rankings reflects inconsistent reporting to specific databases rather than an actual gap in trade activity.
This distinction matters commercially. A buyer or analyst who concluded from the 2023 Comtrade snapshot alone that Iran is a minor or negligible bitumen exporter would be working from an incomplete and likely misleading picture.
Key Takeaways
- No single trade-data source provides a fully reliable, consistent bitumen export ranking; Comtrade, WITS, and WTO data disagree meaningfully by year and, in Iran's case, by whether the country reported to a given database at all.
- Iran ranked 2nd globally in UN Comtrade's 2021 bitumen export data ($1.43B) and reported $2.165B in bitumen exports to the WTO for 2024 — figures that place it among the world's largest exporters, contrary to its absence from a commonly cited 2023 Comtrade snapshot.
- Canada, the European Union, Singapore, and South Korea appear consistently as major exporters across multiple years and data sources.
- Canada's export profile is heavily concentrated in a single relationship — exports to the United States, representing roughly one-fifth of total world export value in 2023.
- Singapore functions primarily as a regional trading and re-export hub rather than a primary crude-oil producer.
- Iraq and the UAE are significant suppliers to South Asia specifically (India, and Turkey in Iraq's case), though complete bitumen-specific export totals for these countries were not identified in this research and should not be assumed.
- For Gulf-origin bitumen specifically, and Iranian-origin bitumen in particular, buyers should treat any single trade-database ranking as directional at best and combine it with direct supplier verification and appropriate compliance review.
Global Bitumen Export Snapshot
| Factor | Position |
|---|---|
| Most consistently top-ranked exporters (multi-year, multi-source) | Canada, European Union, Singapore, South Korea |
| Most significant single finding of this research | Iran likely ranks among the top 2–3 exporters by value, despite absence from some single-year snapshots |
| Data reconciliation required | UN Comtrade / WITS vs. WTO Tariff & Trade Data show materially different pictures for at least one major exporter (Iran) |
| Most recent complete Comtrade year (non-Iran figures) | 2023 |
| Most recent Iran-specific figure identified | 2024 (WTO Tariff & Trade Data, Iran's own reported customs data) |
| Countries with confirmed significant bilateral flows but no confirmed total | Iraq (→India, →Turkey), UAE (→India) |
| Key buyer implication | Single-source export rankings should not be used alone to assess Gulf-region supplier significance |
Why Ranking Bitumen Exporters Requires Cross-Referencing Multiple Sources
Most commodity-export rankings can be built reliably from one trusted data source. Bitumen — and Gulf-region bitumen trade in particular — is a case where that approach produces materially misleading conclusions if applied uncritically.
The product category itself is narrow. HS code 271320 ("Petroleum bitumen") covers refined, paving-grade bitumen specifically. A separate code, HS 2714, covers natural asphalt and asphaltites — a different, smaller category. Reports that blend the two, or that don't specify which code they use, produce numbers that are not comparable to each other.
Reporting to UN Comtrade is voluntary and inconsistent year to year, for many countries — not only Iran. Comtrade compiles the trade statistics that individual national customs authorities choose to submit. When a country does not submit data for a given commodity in a given year, that country simply does not appear in that year's aggregated ranking — which can look, to a casual reader, like the country stopped exporting, when in fact it may simply mean the customs authority did not submit that particular dataset to the UN Statistics Division that year.
This is exactly what appears to have happened with Iran's 2023 bitumen data. Iran's absence from the commonly cited 2023 Comtrade "top exporters" list is not corroborated by an actual decline in Iranian bitumen trade — quite the opposite. Iran ranked 2nd globally in Comtrade's own 2021 data, and Iran's own reported figures to the WTO's Tariff & Trade Data platform show $2.165 billion in bitumen exports for 2024, a figure in the same range as Canada's leading 2023 Comtrade value. Trade-finance and documentation complexity connected to sanctions on Iran plausibly contributes to inconsistent reporting patterns across different international databases, but the more directly evidenced explanation — supported by the fact that Iran's data does appear prominently in two of the three sources checked for this report — is a database-specific reporting gap rather than systematic invisibility of the trade itself.
For buyers, the practical implication is straightforward: do not treat any single trade database's snapshot, for any given year, as a complete picture of Gulf-region bitumen export activity. This report's approach — checking multiple sources and multiple years, and flagging discrepancies explicitly rather than picking whichever number is easiest to present — is the standard buyers should expect from any credible market-intelligence source on this commodity.
Bitumen Export Data by Source: A Reconciliation Table
Rather than presenting one ranking as definitive, the table below shows what each major data source reports, explicitly labeled by year and source, so readers can see where sources agree and where they diverge.
| Country / Bloc | UN Comtrade / WITS 2021 | UN Comtrade / WITS 2023 | WTO Tariff & Trade Data (most recent available) |
|---|---|---|---|
| Canada | $1.30B | $2.18B | Not separately identified in this research |
| European Union (bloc) | $1.81B | $1.86B | Not applicable (bloc, not single WTO member profile) |
| Iran | $1.43B (ranked 2nd globally) | Not present in dataset | $2.165B (2024) |
| Singapore | $1.08B | $1.44B | Not separately identified in this research |
| South Korea | $899M | $885M | Not separately identified in this research |
| Greece | Not separately identified in 2021 data reviewed | $724M | Not separately identified in this research |
This table intentionally shows gaps rather than filling them with estimates. Where a cell says "not separately identified," it means this research did not locate a reliable figure for that country/year/source combination — not that the figure is zero.
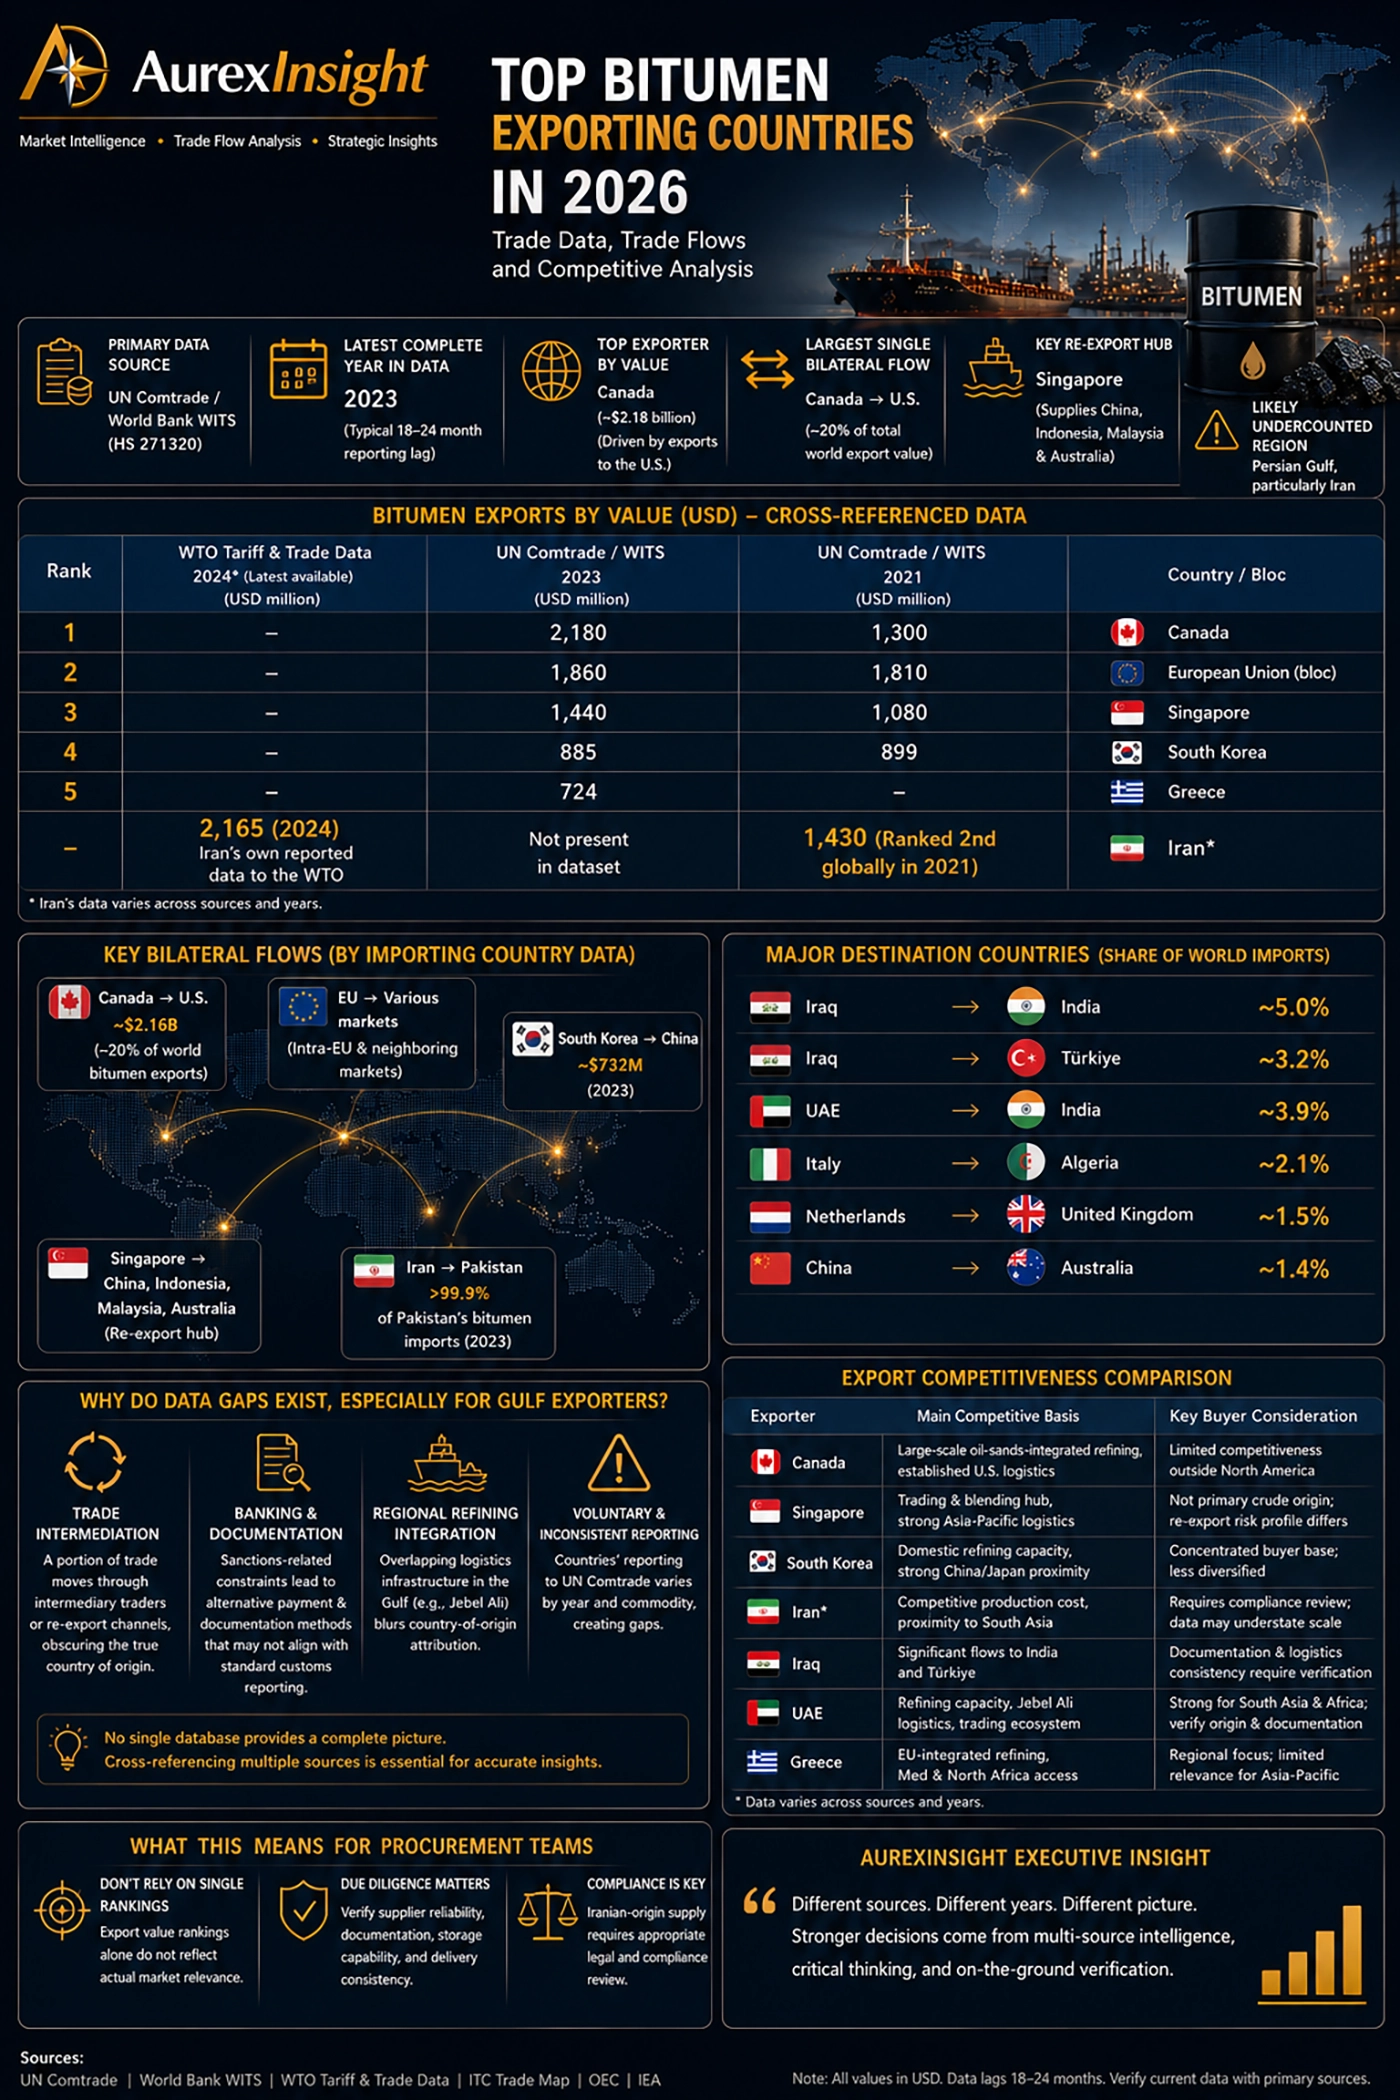
Figure 1. Top Bitumen Exporting Countries in 2026 — Cross-Referenced Trade Intelligence
This infographic summarizes the key findings of this research by combining official trade statistics from UN Comtrade/WITS and the World Trade Organization (WTO) with major international trade corridors and exporter profiles.
Rather than presenting a single ranking, it illustrates how exporter positions change depending on the reporting source and year. It also highlights Iran's contrasting visibility across databases, the importance of regional trade hubs such as Singapore, and the dominant North American trade corridor between Canada and the United States.
The visual reinforces one of this report's central conclusions:
Reliable supplier evaluation requires combining multiple trade databases with regional market intelligence rather than relying on a single export ranking.
What We Could Not Confirm: Iraq and the UAE
Both Iraq and the UAE are consistently referenced across regional trade publications and appear with confirmed, significant bilateral bitumen flows to specific destinations:
| Exporter | Confirmed Bilateral Flow | Share of That Destination's World Imports |
|---|---|---|
| Iraq | Iraq → India | ~5.0% of India's world bitumen imports |
| Iraq | Iraq → Turkey | ~3.2% of Turkey's world bitumen imports |
| UAE | UAE → India | ~3.9% of India's world bitumen imports |
However, this research did not identify a reliable total bitumen export value for either Iraq or the UAE across all destinations combined. Both countries are major overall petroleum exporters — the UAE recorded $429.4 billion in total exports in 2024, and Iraq recorded roughly $115.9 billion in total exports in 2023, dominated overwhelmingly by crude oil — but bitumen (HS 271320) is a comparatively small line item within each country's much larger petroleum export base, and this research could not locate a total bitumen-specific figure with confidence for either country.
This is stated explicitly rather than filled in with an estimate, consistent with this report's standard of not presenting unverified figures as fact. Readers who need Iraq- or UAE-specific total bitumen export values should treat this as an open research question requiring direct verification with national customs authorities or a paid trade-data subscription service with more granular access than the sources reviewed for this report.
Canada: A Consistent Top Exporter, Concentrated in One Market
Canada appears as a top-tier exporter in both 2021 ($1.30B) and 2023 ($2.18B) Comtrade data, with growth between these years likely reflecting a combination of price increases and volume growth. Canada's export profile is heavily concentrated in a single relationship: exports to the United States accounted for roughly one-fifth of total world bitumen export value in 2023, reflecting Canada's integrated oil-sands and refining base and mature cross-border logistics.
For buyers outside North America, Canada's relevance is limited in practical terms — its export flows are concentrated toward the U.S. market, and freight costs to Asia, Africa, or the Middle East are generally uncompetitive against Gulf or Asian suppliers.
Singapore: A Trading Hub, Not a Primary Producer
Singapore's export value grew from $1.08B (2021) to $1.44B (2023) in Comtrade data, consistently placing it among the top exporters despite not being a large-scale crude-oil producer. Singapore's role is structurally different from Canada's or Iran's: it functions primarily as a regional blending, storage, and trading hub, drawing on imported feedstock and re-exporting finished, graded product to Asia-Pacific buyers — notably China, Indonesia, Malaysia, and Australia.
For buyers evaluating supply security, this distinction matters: a disruption affecting Singapore's blending or storage operations carries different risk implications than a disruption affecting a primary refining center in Canada, Iran, or South Korea.
South Korea: Consistent, China-Concentrated Exports
South Korea's export value has remained relatively stable across the years reviewed ($899M in 2021, $885M in 2023), with China as the dominant destination. This reflects substantial domestic refining capacity combined with geographic proximity to major Northeast Asian demand centers, making South Korea a comparatively straightforward primary-origin supplier for buyers in the region.
Iran: The Most Significant Finding of This Analysis
Iran deserves dedicated treatment in this report because the data genuinely supports a different conclusion than a casual reading of a single trade database would suggest.
What the evidence shows:
- In UN Comtrade's 2021 data, Iran ranked 2nd globally by bitumen export value, at $1.43 billion — ahead of Canada and Singapore that year.
- Iran does not appear in the commonly cited 2023 Comtrade "top exporters" aggregation.
- In the WTO's own Tariff & Trade Data platform — which draws on Iran's officially reported trade statistics — Iran's bitumen exports were reported at $2.165 billion for 2024, representing 3.9% of Iran's total exports that year. This figure is comparable to, and potentially larger than, Canada's leading 2023 Comtrade figure.
- Iran's bitumen trade with specific partners is independently corroborated through "mirror data" — statistics reported by importing countries. Pakistan's 2023 import data, for example, shows that essentially all of Pakistan's bitumen imports (over 99.9% by value) came from Iran, a relationship visible in Comtrade even where Iran's own exporter-side reporting for that year is absent.
What this evidence does not show: a precise, continuous, year-by-year trend for Iran's bitumen exports, or a single number that can be presented with full confidence as "Iran's 2026 bitumen export value." The available data points (2021 Comtrade, 2024 WTO) come from different reporting systems and years, and this report does not treat them as directly comparable in a strict statistical sense — only as consistent directional evidence that Iran is a top-tier global bitumen exporter, not a marginal or "hidden" one.
Why the reporting gap likely exists: the most parsimonious explanation is that Iran's customs authority did not submit 2023 bitumen trade data to the UN Statistics Division for Comtrade compilation that year — a reporting gap, not a trade gap. Sanctions-related banking and trade-finance complexity plausibly affects how some Iranian export transactions are documented and may contribute to inconsistent reporting patterns across different international databases, but this report cannot confirm that as the specific mechanism behind the 2023 Comtrade gap, and presents it as a plausible contributing factor rather than a confirmed cause.
What this means for buyers: Iran should be treated as a major bitumen supplier when evaluating Gulf-region sourcing options — not overlooked on the basis of its absence from any single ranking. At the same time, sourcing Iranian-origin bitumen requires dedicated sanctions-compliance and trade-finance due diligence, independent of the country's export scale, consistent with standard practice for any commodity of Iranian origin.
Export Competitiveness Comparison
Different exporters solve different procurement problems, and country-level data limitations mean this comparison should be read as directional guidance rather than a precise ranking.
| Exporter | Main Competitive Basis | Key Buyer Consideration |
|---|---|---|
| Canada | Large-scale oil-sands-integrated refining, established U.S. logistics | Limited competitiveness outside North America due to freight distance |
| European Union (bloc) | Large, diversified refining base across member states | Aggregate bloc figure; competitiveness varies significantly by individual member state |
| Singapore | Trading and blending hub, strong Asia-Pacific logistics | Not primary country of crude origin; re-export risk profile differs from direct producers |
| South Korea | Domestic refining capacity, strong China proximity | Concentrated buyer base; consistent year-to-year reporting |
| Iran | Large, consistently top-tier export value across multiple sources; competitive production cost; proximity to South Asia | Requires dedicated sanctions-compliance and trade-finance review; do not rely on any single trade-database ranking to assess scale |
| Iraq | Confirmed significant flows to India and Turkey | Total export value not confirmed in this research; verify directly |
| United Arab Emirates | Confirmed flow to India; strong regional logistics (Jebel Ali) | Total bitumen export value not confirmed in this research; verify directly |
| Greece | EU-integrated refining, Mediterranean and North Africa access | Regional focus; limited relevance for Asia-Pacific buyers |
What This Means for Procurement Teams
First, do not use any single trade-database export ranking as a standalone supplier-selection or market-sizing tool. This report's central finding — that Iran's position shifts dramatically depending on which database and year is consulted — demonstrates why. The same risk likely applies, to a lesser-documented degree, to Iraq and the UAE, where this research could not even confirm total bitumen export figures despite clear evidence of significant trade activity.
Second, treat Iranian-origin bitumen sourcing as requiring dedicated compliance review, not as a reason to discount Iran's market significance. The evidence in this report suggests Iran is a top-tier global exporter by value, not a marginal supplier. Buyers should conduct appropriate legal and sanctions-compliance review before engaging with Iranian-origin supply — a standard practice for Iranian-origin commodities generally — while recognizing that this compliance requirement exists independent of, not because of, Iran's actual market scale.
Third, prioritize direct supplier and regional-market verification over trade-database rankings for Gulf-origin sourcing decisions specifically. The data gaps identified for Iraq, the UAE, and Iran's 2023 figures all point to the same conclusion: publicly available trade statistics, however authoritative in principle, have real limitations for this commodity and this region that direct sourcing intelligence can help fill.
AurexInsight Executive Insight
The most valuable finding in this report is not a ranking — it is the discovery that a ranking, presented from a single data source, would have been actively misleading.
Iran's apparent absence from a commonly cited 2023 export ranking, set against its 2nd-place global ranking in 2021 and its $2.165 billion reported figure to the WTO for 2024, illustrates a broader principle that applies well beyond bitumen: for commodities where trade intermediation, sanctions exposure, or inconsistent national reporting practices are present, single-source market intelligence is not just incomplete — it can actively point buyers and analysts toward the wrong conclusion.
From an AurexInsight perspective, this reinforces why cross-referencing multiple data sources, explicitly flagging discrepancies, and stating what could not be confirmed is not an optional refinement — it is the minimum standard for credible commodity market intelligence in regions and product categories where data quality is inherently uneven.
Organizations evaluating bitumen suppliers, and Gulf-region suppliers specifically, should apply the same standard: treat any single ranking as a starting hypothesis to verify, not a conclusion to act on.
Frequently Asked Questions
Which country exports the most bitumen?
This depends significantly on which year and data source is consulted. Canada led UN Comtrade's 2023 data at $2.18 billion, but Iran ranked 2nd globally in Comtrade's 2021 data ($1.43 billion) and reported $2.165 billion in bitumen exports to the WTO for 2024 — a figure comparable to Canada's. There is no single reliable answer to this question without specifying the year and data source.
Why does Iran's ranking vary so dramatically between different reports and years?
Iran's bitumen export data appears prominently in some authoritative sources (2nd globally in UN Comtrade's 2021 data; $2.165 billion reported to the WTO for 2024) but is absent from others (the commonly cited 2023 UN Comtrade ranking). The most likely explanation is inconsistent submission of trade data to specific international databases in specific years — a reporting gap rather than an actual decline in Iranian bitumen exports. Sanctions-related trade-finance and documentation complexity may contribute to this pattern, though this report cannot confirm the specific mechanism with certainty.
Is Iran a major or minor bitumen exporter?
Based on the evidence reviewed in this report, Iran should be considered a major bitumen exporter — likely among the top 2–3 globally by value in most years — despite its absence from some single-year, single-database rankings. Buyers should not conclude Iran is a minor supplier based on any one data source alone.
Is Singapore a major bitumen producer?
Not primarily. Singapore's strong export position reflects its role as a regional trading, blending, and re-export hub rather than large-scale domestic crude-oil production. It supplies significant volumes to China, Indonesia, Malaysia, and Australia.
Why is Canada's export value so concentrated in one destination?
Canada's leading position is driven almost entirely by exports to the United States, reflecting its integrated oil-sands and refining base and mature cross-border logistics. This concentration means Canada is generally not a cost-competitive source for buyers outside North America.
What are the total bitumen export values for Iraq and the UAE?
This report could not confirm reliable total bitumen-specific export figures for either country, despite identifying significant confirmed bilateral flows (Iraq to India and Turkey; UAE to India). Readers requiring these figures should verify directly with national customs authorities or specialized trade-data subscription services.
Should buyers avoid Gulf-region bitumen suppliers because of data-quality concerns?
No. Data-quality limitations reflect how trade is captured statistically, not a quality or reliability issue with the product or suppliers themselves. Buyers should combine available trade data with direct supplier due diligence and, for Iranian-origin supply specifically, appropriate sanctions-compliance review.
What is the difference between HS code 271320 and HS code 2714 for bitumen trade statistics?
HS 271320 covers "Petroleum bitumen" — the refined, paving-grade product derived from crude oil refining, and the subject of this report. HS 2714 covers natural asphalt, asphaltites, and asphaltic rocks — a much smaller, largely unrelated category. Reports that blend these two codes without specifying which one they use produce figures that are not meaningfully comparable.
References
- UN Comtrade Database
- World Bank — World Integrated Trade Solution (WITS)
- World Trade Organization — Tariff & Trade Data (ttd.wto.org)
- Observatory of Economic Complexity (OEC)
- International Trade Centre (ITC) Trade Map
Related AurexInsight Research
- Global Bitumen Market Outlook 2026
- Why the Strait of Hormuz Matters for Global Commodity Trade in 2026
- How Regional Tensions Are Reshaping Global Commodity Markets in 2026
- Global Sulfur Market Outlook 2026
- Top Sulfur Exporting Countries in 2026
About AurexInsight
AurexInsight is an independent Market Intelligence platform focused on international trade, commodity markets, supplier evaluation, trade-flow analysis, and opportunity development.
Our mission is to help buyers, producers, traders, and decision-makers transform market intelligence into trusted business opportunities through data-driven insights, practical market research, and strategic market intelligence.
Disclaimer
This report is provided for informational and market-intelligence purposes only.
It should not be considered investment, legal, financial, procurement, or commercial advice.
Trade statistics for this commodity vary meaningfully across data sources, years, and reporting jurisdictions, as this report demonstrates directly. Readers should conduct independent research, verify current data with primary sources or specialized trade-data services, and seek appropriate legal and compliance guidance — particularly regarding Iranian-origin supply — before making business or investment decisions.
Published by
AurexInsight Research
AurexInsight publishes market intelligence, supplier validation insights, trade-flow analysis and opportunity-focused research for international business decision-makers.
Related Research
Continue exploring this market theme
These related insights help build a clearer view of the market context, supply-chain risks and commercial opportunities connected to this analysis.
Global Bitumen Market Outlook 2026: Supply, Demand, Trade Flows and Price Drivers
An in-depth analysis of the global bitumen market in 2026, covering supply, demand, refining economics, trade flows, pricing drivers, major exporters, and the Strait of Hormuz risk factor.
Read insightMarket OutlookTop Sulfur Exporting Countries in 2026: Production, Trade Flows and Competitive Analysis
A market-intelligence analysis of the top sulfur exporting countries in 2026, covering production strength, export infrastructure, trade flows, competitive advantages, and buyer considerations.
Read insightMarket OutlookGlobal Sulfur Market Outlook 2026: Supply, Demand, Trade Flows and Industry Trends
An in-depth analysis of the global sulfur market in 2026, covering supply, demand, international trade flows, pricing factors, major exporters, and industry outlook.
Read insight